
Understand the Market Before You Trade It.
Technical analysis, market intelligence, sector insights, trading tools, and scenario-based research for U.S. markets.
- Primary + alternate scenarios
- Invalidation defined upfront
- Updated as market structure evolves
FutureWaveAnalysis is under active development. Features, data, content, and analysis may change as the platform is tested and improved.
Information shown during this phase is for testing and educational purposes.Primary Scenario
NOW · Wave (3) Advance
Defined Invalidation
Key Structure Level
NOW · ServiceNow
Primary Analysis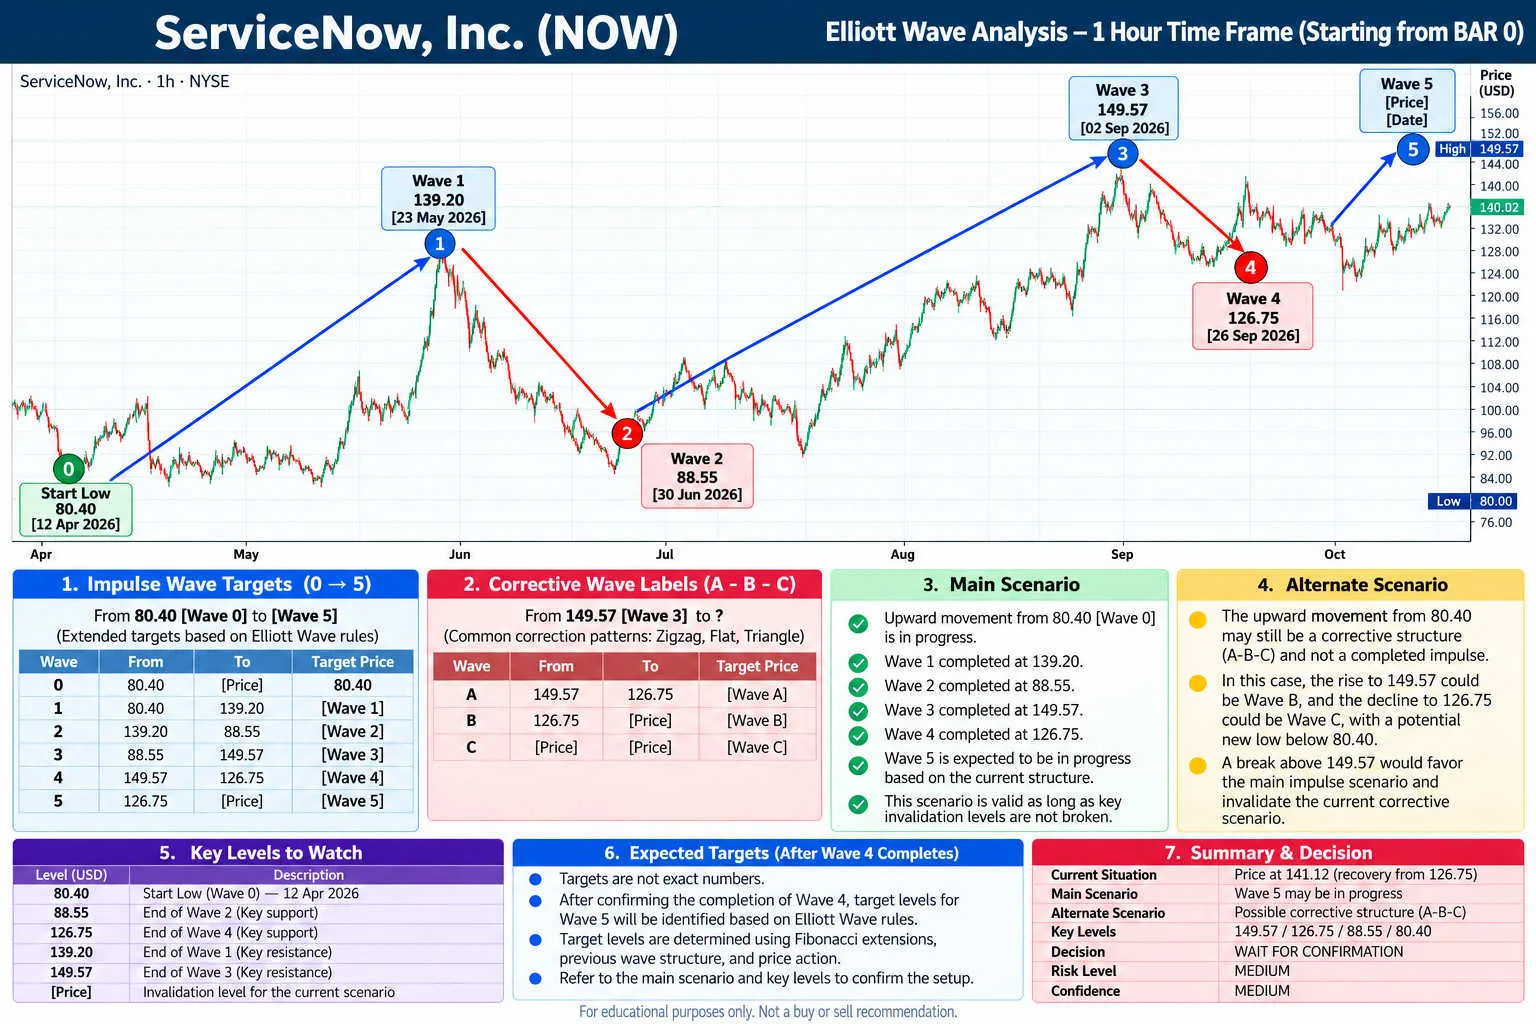
Structure mapping: multi-degree wave counts, primary path, alternate scenario, and key invalidation levels.
WHAT YOU GET
Research Built Around Market Structure
A complete suite of market research, technical structure maps, sector intelligence, and risk tools.
Market Brief
Daily perspectives on market tone, macroeconomic catalysts, key indices, and risk sentiment.
Technical Analysis
Scenario-based chart mapping with defined wave counts, critical levels, and pre-calculated invalidation.
Sector Intelligence
Track sector leadership, lagging groups, defensive flows, and relative strength across market cycles.
Trading Tools
Interactive position size calculators, risk-to-reward ratios, and Fibonacci confluence levels.
MARKET SNAPSHOT
Current Market Tone & Macro Environment
Live market tone, trend structure, and sentiment indicators will appear here once connected.
Real-time implied volatility tracking and index metrics coming soon.
Live relative strength analysis and sector rotation data coming soon.
Macroeconomic environment tracking and treasury yield metrics coming soon.
MARKET RESEARCH
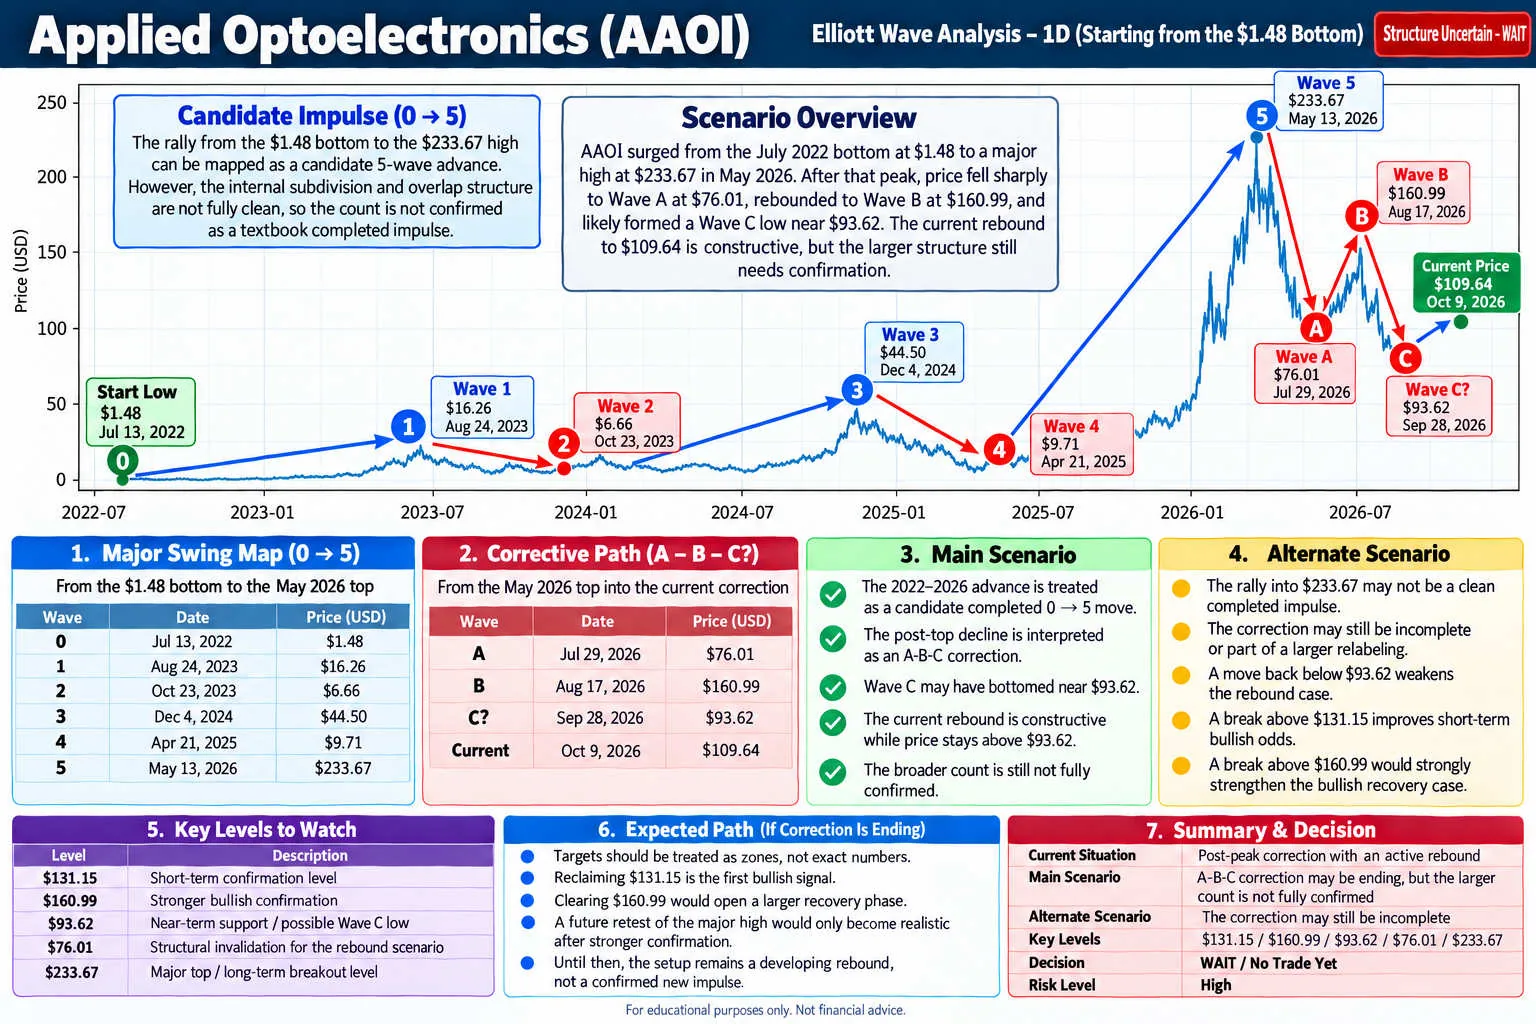
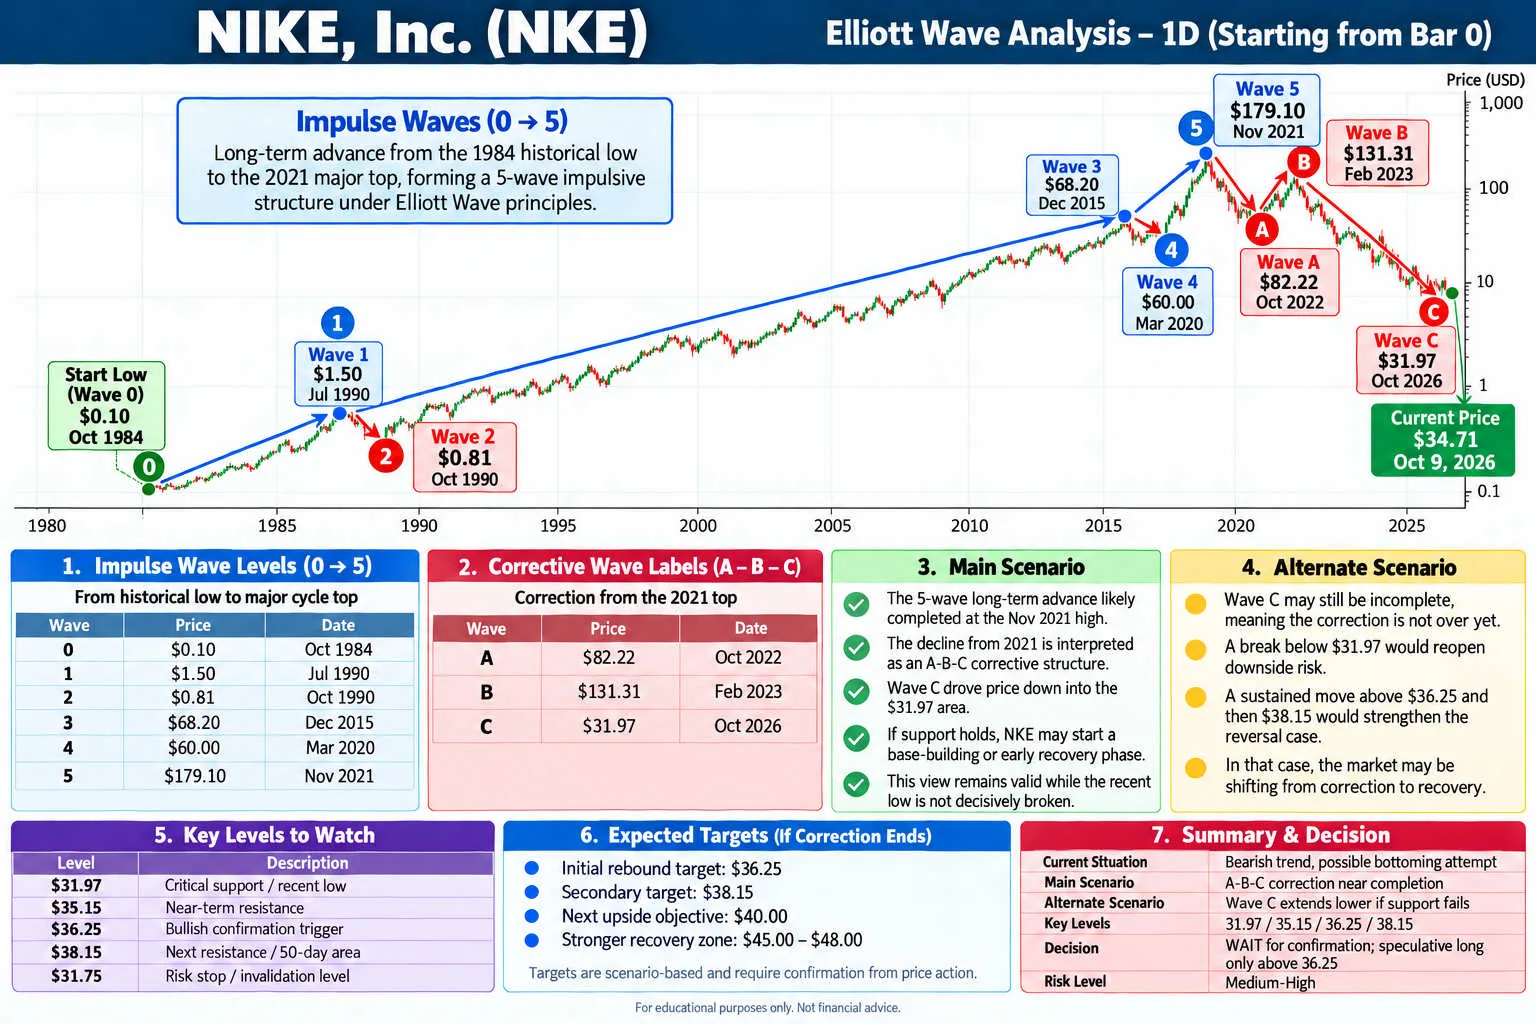
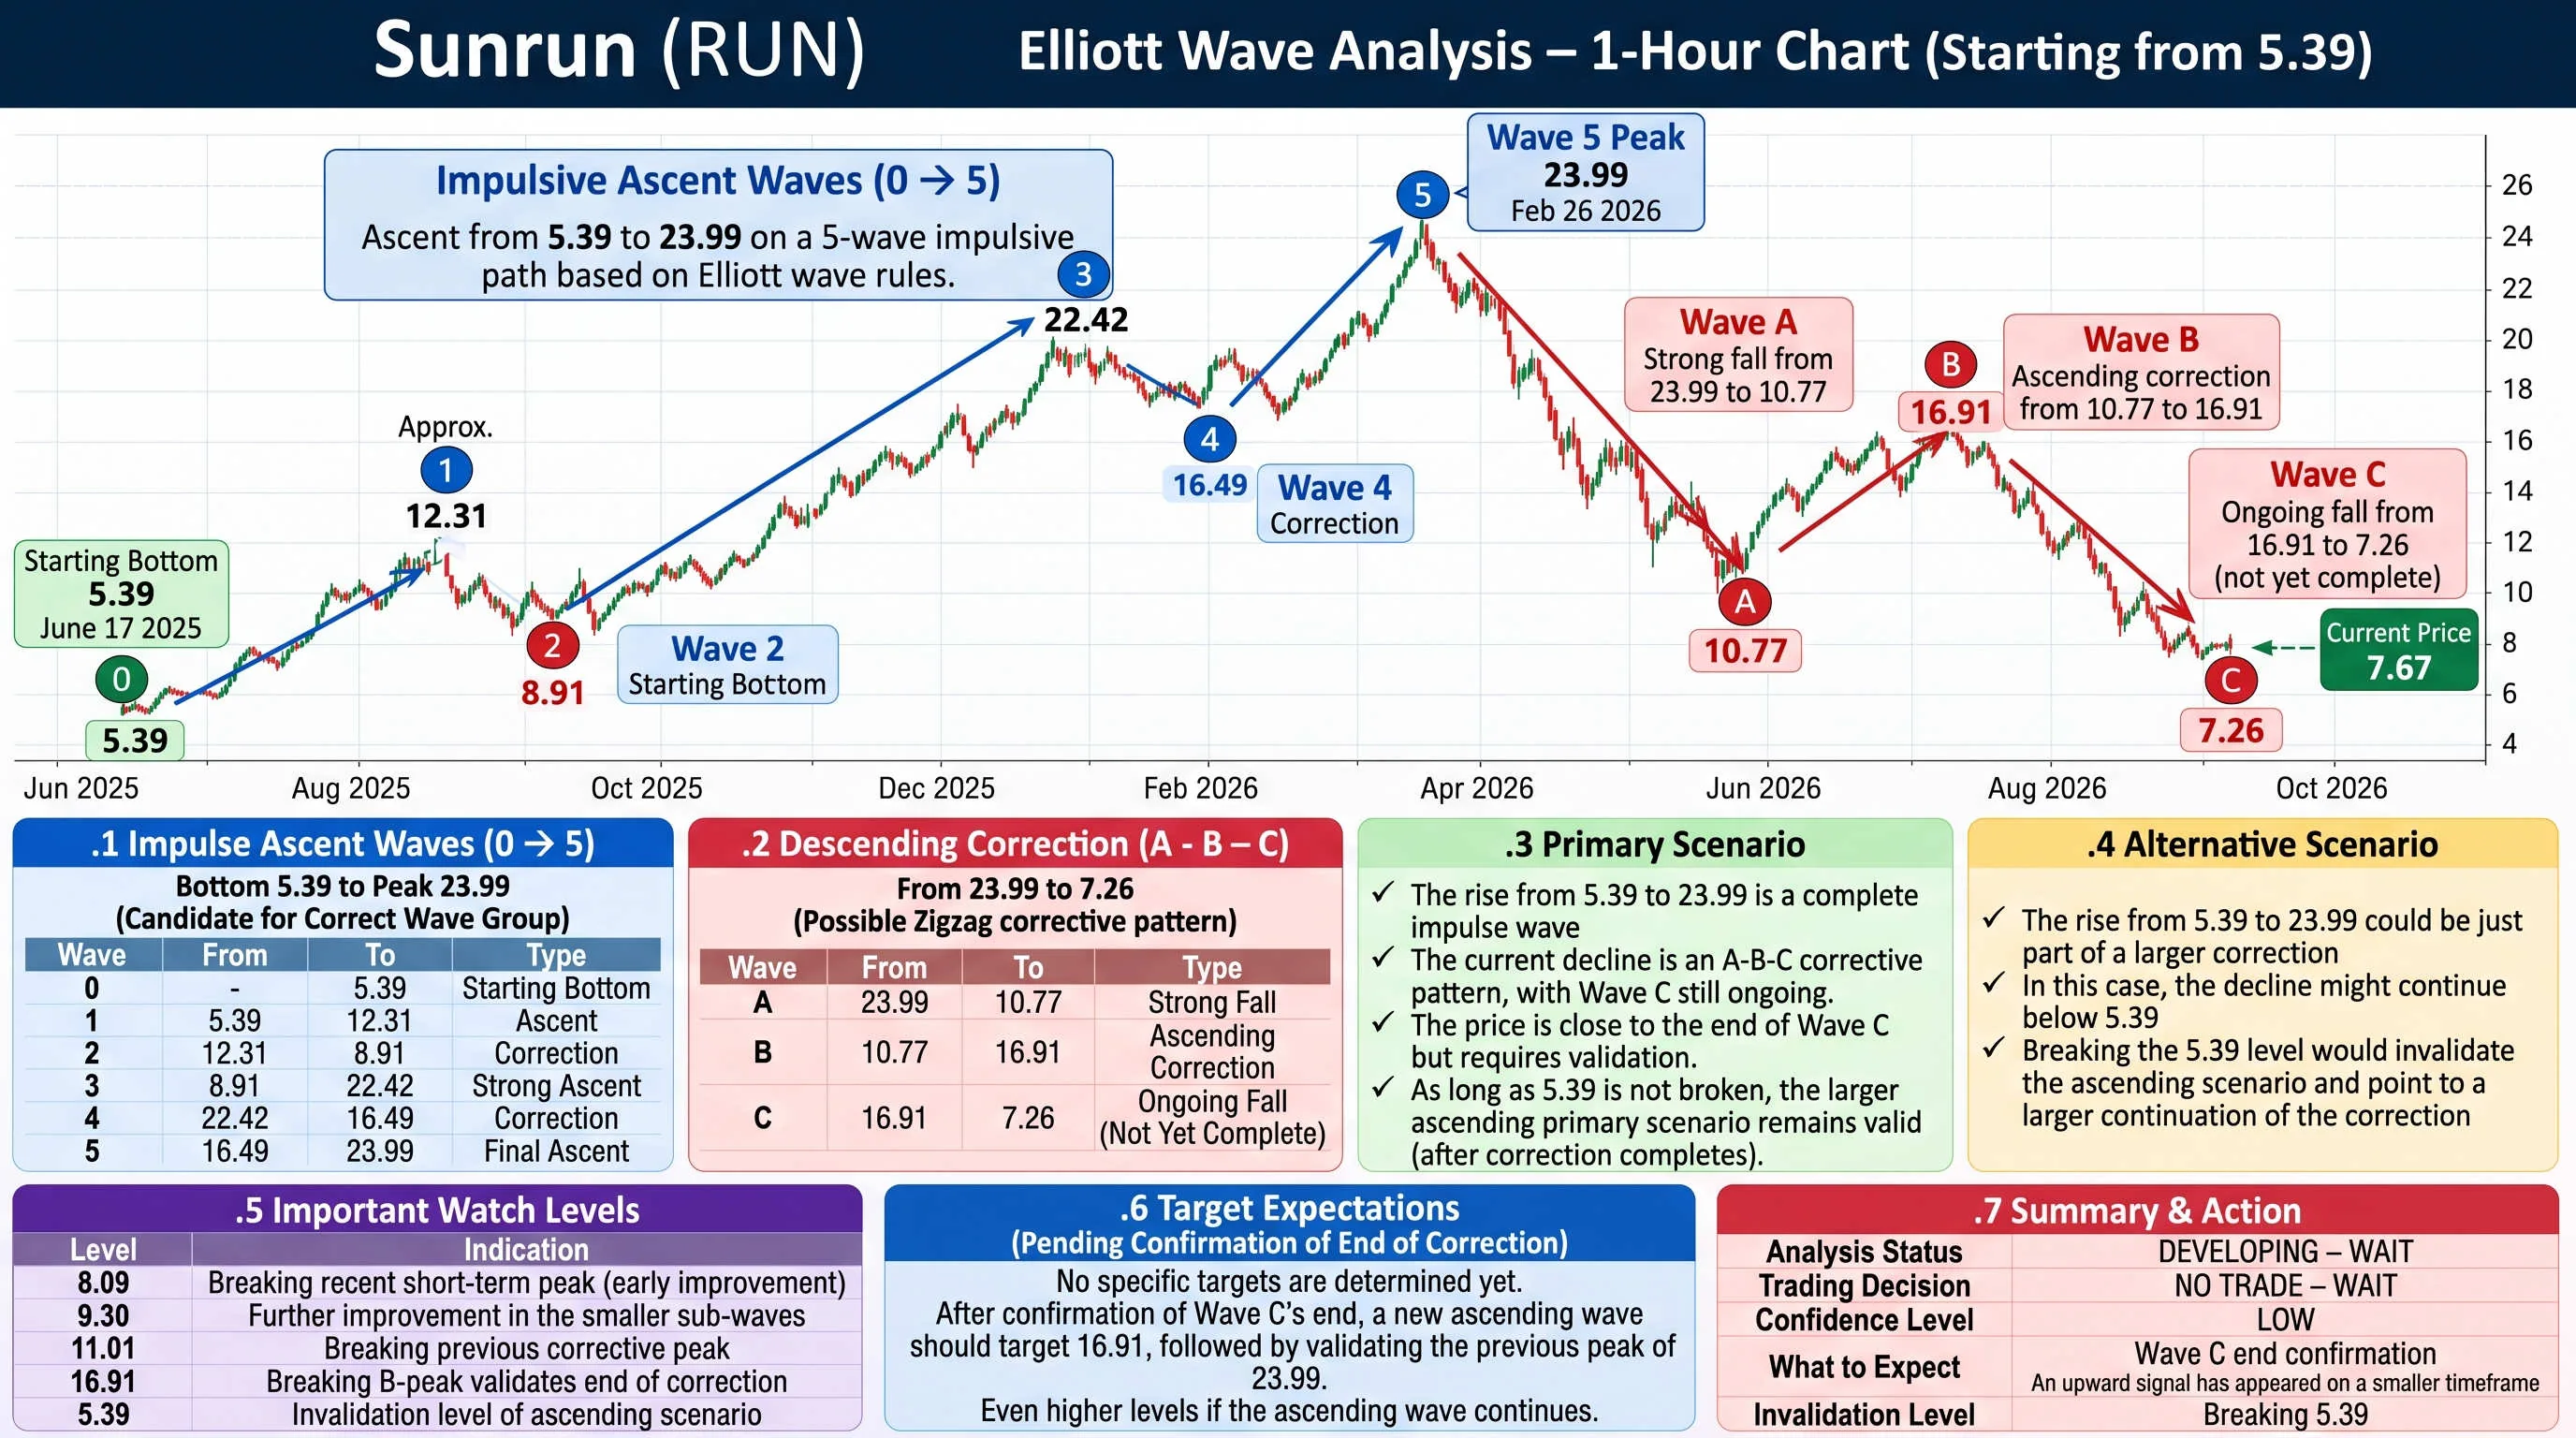
Latest Technical Analysis
Structured chart evaluations across active equities. Every idea maps primary and alternate scenarios, clear invalidation levels, and measured targets.
SECTOR INTELLIGENCE
Sector Watch & Capital Rotation
Tracking relative strength, institutional capital rotation, and structural trends across major market sectors.
Leading Sectors
Live sector rotation data coming soon. Relative strength analysis and sector leadership tracking will be published here.
Weak Sectors
Live sector rotation data coming soon. Lagging sector identification and risk warning metrics will be published here.
Healthcare / Pharma
Live sector rotation data coming soon. Multi-month accumulation base tracking and defensive flow metrics will be published here.
Rotation Dynamics
Live sector rotation data coming soon. Cyclical rotation signals and breadth expansion metrics will be published here.
SCENARIO ANALYSIS
Market Ideas & Scenario Studies
Educational scenario studies illustrating structure mapping, invalidation levels, and trigger confirmation. Published for research purposes only — no financial advice or guaranteed returns.
Pullback to Key Support Confluence
Price retesting a high-volume node and 61.8% Fibonacci zone following an impulsive 5-wave breakout. Momentum oscillators displaying hidden divergence.
Resistance Retest & Distribution
Corrective relief rally meeting heavy overhead volume supply and a Wyckoff Upthrust retest. Decreasing buying volume signals exhaustion.
Symmetrical Range Contraction
Volatility contraction pattern within an ascending base. Price compressing into the apex; awaiting expansion volume for directional confirmation.
PRACTICAL UTILITIES
Trader Tools & Calculators
Control risk, size positions, and calculate Fibonacci levels before entering the market.
Position Size Calculator
Calculate exact share size based on account equity, maximum risk percentage, entry price, and stop loss.
Risk / Reward Calculator
Evaluate risk-to-reward payoff, breakeven win rate requirements, and trade asymmetry for long and short setups.
Fibonacci Calculator
Calculate key retracements (38.2%, 50%, 61.8%) and impulse extensions (100%, 161.8%, 261.8%) for swing targets.
OUR METHODOLOGY
How We Analyze the Market
A disciplined, multi-layered approach combining structural wave patterns, institutional volume, and key liquidity levels.
Elliott Wave
Multi-degree wave mapping to identify primary cycles, impulse legs, and corrective structures.
Wyckoff
Phase analysis identifying accumulation, markup, distribution, springs, and upthrust tests.
Volume Analysis
Volume spread analysis and volume profile checking institutional participation at critical levels.
Market Structure
Tracking swing pivots, breaks of structure (BOS), change of character, and supply/demand zones.
Fibonacci
Confluence clusters, golden ratio retracements, and expansion targets establishing objective inflection points.
VERIFIABLE RESEARCH
Transparent Analysis. Results Included.
We are building a transparent analysis record that will track published scenarios, key levels, invalidations, and outcomes.
Documented Scenarios
Primary and alternate paths mapped before market opens.
Fixed Invalidation
The exact price level that proves the scenario wrong.
Verifiable Outcomes
Clear record of targets hit or invalidations triggered.
Latest Articles
Market context, technical analysis, sector developments, and company-focused research.