
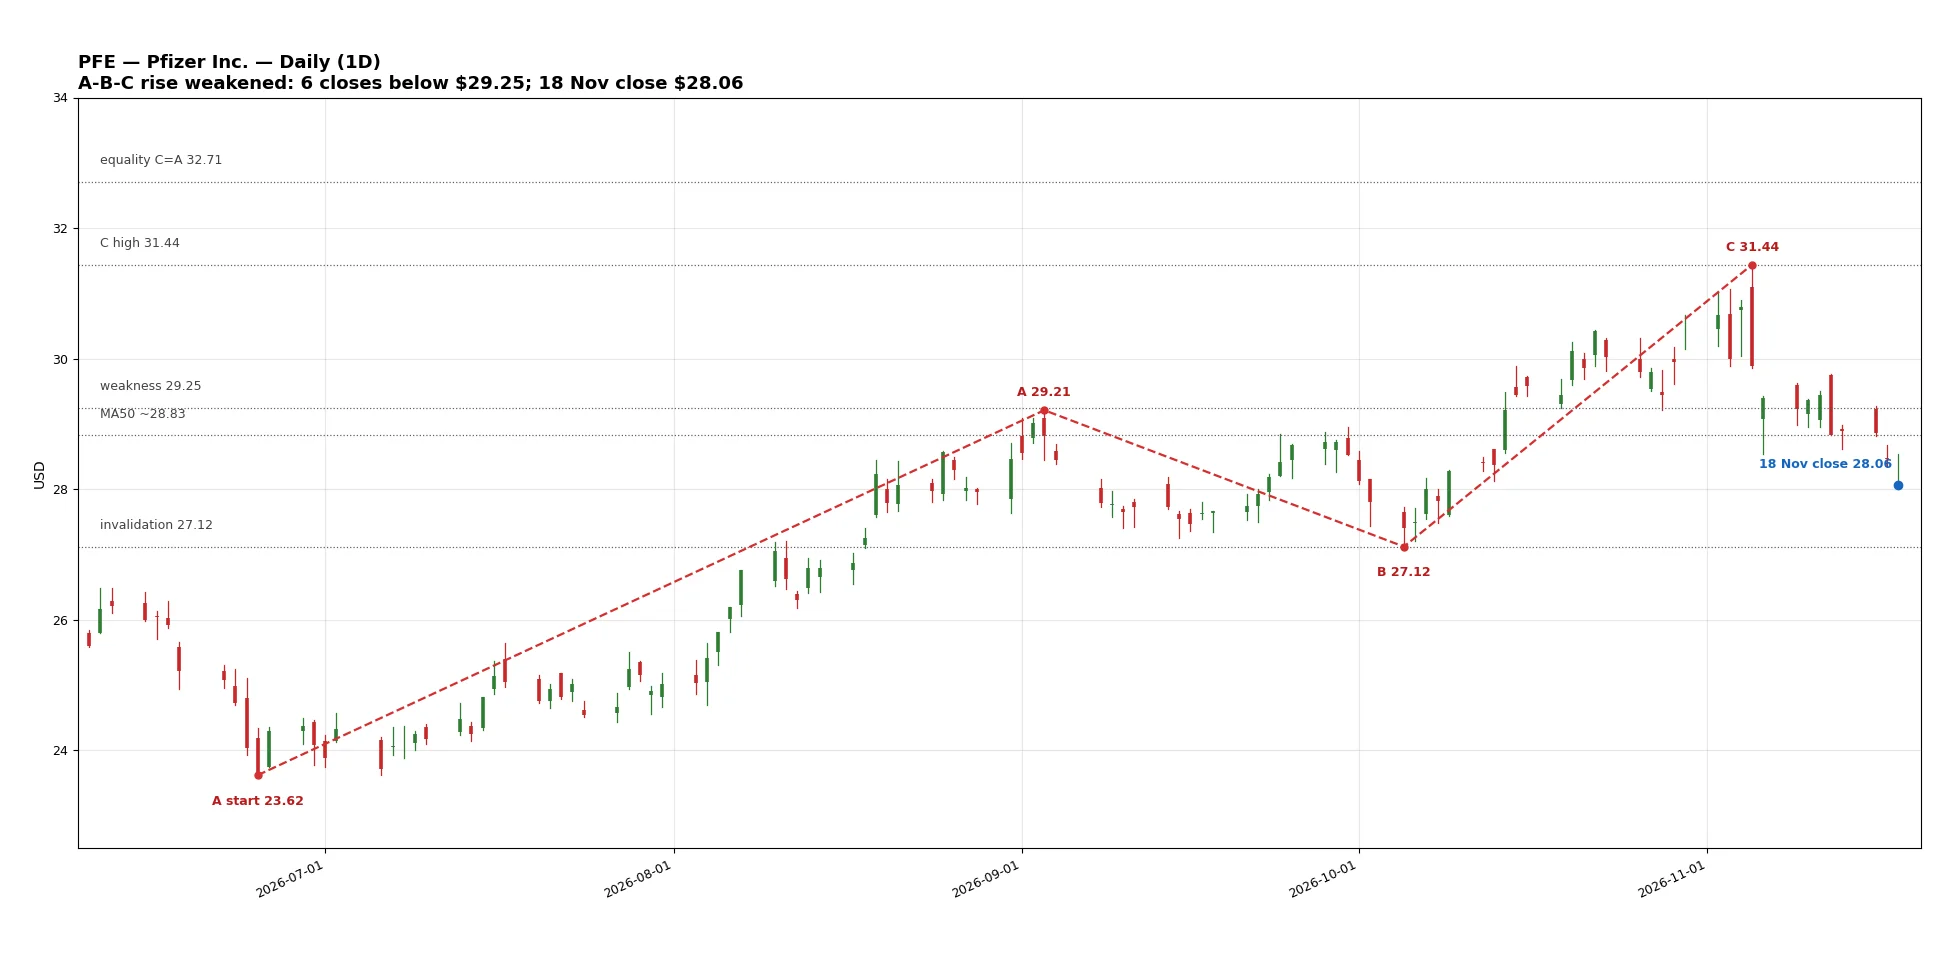
Pfizer Inc. (PFE) — Daily timeframe: A-B-C rise weakened after 6 closes below $29.25, closing at $28.06
Company: Pfizer Inc. (NYSE: PFE)
Analysis date: 18 November 2026
Update time and timezone: Evening of 18 November 2026, Toronto time (EST), after the close of Wednesday 18 November 2026
Analysis timeframe: Daily (1D)
Reference price: $28.06, close of 18 November 2026
Previous close: $28.47, 17 November 2026
18 November session: Open $28.06, high $28.54, low $28.00, close $28.06 (-$0.41, -1.44%)
Source of figures: Daily market data (Yahoo Finance), full 18 November candle.
Educational scenario-based analysis, not a buy, sell or hold recommendation. The count is reassessed with every new daily close.
The Picture in a Minute
After the 4 November close at $30.79, the stock touched a new 52-week high of $31.44 intraday on 5 November, then reversed in the same session and closed at $29.88 (-2.96%) on 53.1 million shares, and has not closed above $30.44 since — the highest close after that day was $29.88 itself. Six of the next ten closes came in below the $29.25 weakness level (9, 12, 13, 16, 17 and 18 November), and the 18 November close at $28.06 is the lowest close since 8 October, below the 38.2% retracement of the full rise at $28.45 and below the 50-day average (about $28.83). The pullback from the $31.44 high has now retraced 78.2% of wave C, and the $28.06 close sits above the 78.6% retracement of wave C at $28.04 by just two cents, and above the wave B low of $27.12.
The key question: Will price hold above $27.12 (the wave B low) and rebuild a base for the rise, or break it on a close and cancel the bullish count entirely?
Current state in this analysis: A bullish A-B-C count is still in place but badly weakened: the weakness condition (closes below $29.25) has triggered, the pullback has retraced more than three quarters of wave C, and confidence is low-to-medium because the count no longer sits above any strength level — its survival hangs entirely on $27.12 holding on a close.
Where Are We in the Market Structure?
The wave count in detail
- Wave A up: from $23.62 (25 June) to $29.21 (3 September), a length of $5.59.
- Wave B: a pullback to $27.12 (5 October), 37.4% of wave A — a mid-depth correction that did not break the start of wave A.
- Wave C (in progress): from $27.12 to a high of $31.44 (5 November), a length of $4.32 so far, i.e. 77.3% of wave A. The equality target C = A sits at $32.71, and the 1.618 extension at $36.16. The 18 November close of $28.06 has retraced 78.2% of wave C.
Correction to the 4 November analysis levels
The 4 November analysis printed the wave A top at $28.70 (31 August) and the wave B low at $27.25 (15 September), but the daily candles show price kept rising on 1–3 September to a high of $29.21, and the lowest low of the September–October pullback was $27.12 on 5 October (after an internal rally to $28.95 on 30 September). This correction changes the derived targets: the equality target moves from $32.33 to $32.71, the 1.618 extension from $35.47 to $36.16, and the invalidation level from $27.25 to $27.12. The rest of the count structure (a bullish A-B-C) is unchanged.
Elliott rules check
- Wave B at $27.12 did not break the start of wave A at $23.62 — the rule holds.
- Wave C at $31.44 exceeded the top of wave A at $29.21 — a valid extension of wave C.
- There is no wave 3 here (an A-B-C corrective count), and no wave overlap applies to this structure.
- Main weakness: wave C never reached the $32.71 equality target, then gave back 78.2% of its length in just 9 sessions, with 6 closes below the $29.25 weakness level — the strength of the rise has evaporated, and the count lives on $27.12 holding alone.
What is not confirmed yet
Will price hold above $27.12 and recover $29.59, then $30.44, or break $27.12 on a close and cancel the count? A recovery needs a close above $30.44 first, then above $31.44 to reopen the path to $32.71.
The Levels That Matter
| Level or zone in USD | Its role in the analysis | What are we watching? |
|---|---|---|
| $36.16 | 1.618 extension of wave C | Extended target if price passes equality on a close |
| $32.71 | Equality target C = A | Main wave C target (corrected from $32.33) |
| $31.44 | 5 November high and 52-week high | A daily close above it reopens the extension |
| $31.06 | 3 November high | Price passed it intraday on 5 November, never closed above it |
| $30.44 | Prior C high (22 October) | Broken by closes since 5 November; reclaiming it is the first sign of strength |
| $29.59 | 23.6% retracement of the full 23.62–31.44 rise | First pullback resistance |
| $29.25 | Weakness level | 6 closes below it — the weakness condition has triggered |
| ~$28.83 | 50-day average | Broken by the 18 November close |
| $28.45 | 38.2% retracement of the full rise | Broken by the 18 November close |
| $28.06 | 18 November close | Current price |
| $28.04 | 78.6% retracement of wave C | The close sits above it by just two cents |
| $27.53 | 50% retracement of the full rise | Next pullback support |
| $27.12 | Wave B low / invalidation level | A daily close below it invalidates the bullish count |
| ~$27.02 | 200-day average | Distant trend support, near the invalidation level |
| $26.61 | 61.8% retracement of the full rise | Deeper pullback support |
| $23.62 | 25 June low and wave A start | Low of the current structure |
Confirmation standard used here: a daily close, not an intraday touch. A "strong break" means a clear daily close beyond the level, with follow-through in the next session.
Base Scenario — Pullback in progress toward $27.53, then $27.12
The idea: The 5 November reversal from the $31.44 high (a $29.88 close on 53.1 million shares) broke $30.44 on a close, then came 6 closes below $29.25, and the pullback has retraced 78.2% of wave C. The closest path is a test of $27.53 (the 50% retracement of the full rise), then $27.12 (the wave B low).
It strengthens if: Price closes below $28.04 (the 78.6% retracement of wave C), then below $27.53.
Potential zones, in order:
- $27.53: 50% retracement of the full rise.
- $27.12: wave B low — the invalidation level.
- $26.61: 61.8% retracement of the full rise, if the count is invalidated by a close below $27.12.
Scenario invalidation: A daily close above $30.44 weakens the pullback scenario, and a close above $31.44 restores the extension scenario toward $32.71.
Alternative Scenario — Holding above $27.12 and reclaiming $30.44
It becomes more likely if: The close holds above $27.12, then price closes above $29.59 (the 23.6% retracement) on strong volume.
The likely path: Holding above $27.12, then recovering $28.83 (the 50-day average), then a fresh attempt at $30.44, then at $31.44.
What weakens this path: A daily close below $28.04, then below $27.53.
Scenario invalidation: A daily close below $27.12 invalidates the bullish count entirely, and with it the holding scenario.
What Confirms a Trend Change on the Daily Timeframe?
- Available so far: A new intraday high at $31.44 on 5 November, never confirmed by a close above it, then a reversal on 53.1 million shares, 6 closes below $29.25, and a close below $28.45 and the 50-day average.
- Still missing for confirmation: A daily close below $27.12 to invalidate the bullish count, or a close above $30.44 (then above $31.44) to revive the extension scenario toward $32.71.
Upcoming Events and Risks
- Q3 results — reported before the 3 November open: revenue $16.583 billion vs about $15.85–$15.87 billion expected, adjusted EPS $0.87 vs $0.73 expected, reported EPS $0.56 (down 9% year on year). 2026 revenue guidance was raised to $62–$64 billion (from $60.5–$62.5 billion), and adjusted EPS guidance to $2.95–$3.05 (from $2.80–$3.00), including a one-time $650 million R&D charge linked to the Innovent agreement.
- Dividend: a $0.43 quarterly dividend declared on 6 October went ex-date on 6 November (the low open that day partly reflects it), payable 7 December 2026.
- Next earnings date (Q4): not yet company-confirmed in the sources reviewed for this run, and no single estimated date is printed here as confirmed.
- Volatility: the 5 November session ran from a $31.44 high to a $29.88 close (-2.96%) on 53.1 million shares — an intraday reversal from a fresh 52-week high, followed by a steady pullback with no close above $30.44 since that day.
Conclusion
Under this count, the PFE A-B-C rise is still in place on the rules, but badly weakened: the $31.44 high was never confirmed by a close, the pullback has retraced 78.2% of wave C, and 6 closes sit below $29.25.
Above $30.44 on a daily close: the pullback scenario weakens, and a recovery attempt begins.
Above $31.44 on a daily close: the extension toward the $32.71 equality target is confirmed.
Between $27.12 and $30.44: the pullback is in progress, and holding hangs on $27.12.
Below $27.12 on a daily close: the bullish count is invalidated entirely, opening the way toward $26.61, then $23.62.
*This analysis is based on daily data through the 18 November 2026 close, and needs reassessment after every daily close, when a stated level breaks, and before and after earnings. The zones mentioned are conditional possibilities, not guaranteed prices.*