Space Exploration Technologies Corp. (SPCX) — Daily timeframe: Corrective zigzag complete at $120.39, recovery inside the $128.57–$147.60 range; close at $143.50
Company: Space Exploration Technologies Corp. (NASDAQ: SPCX)
Analysis date: 18 November 2026
Update time and timezone: Evening of 18 November 2026, Toronto time (EST), after the close of Wednesday 18 November 2026
Analysis timeframe: Daily (1D)
Reference price: $143.50, close of 18 November 2026
Previous close: $141.70, 17 November 2026
18 November session: Open $143.24, high $146.31, low $141.22, close $143.50 (+$1.80, +1.27%)
Source of figures: Daily market data (Yahoo Finance), full 18 November candle.
Educational scenario-based analysis, not a buy, sell or hold recommendation. The count is reassessed with every new daily close.
The Picture in a Minute
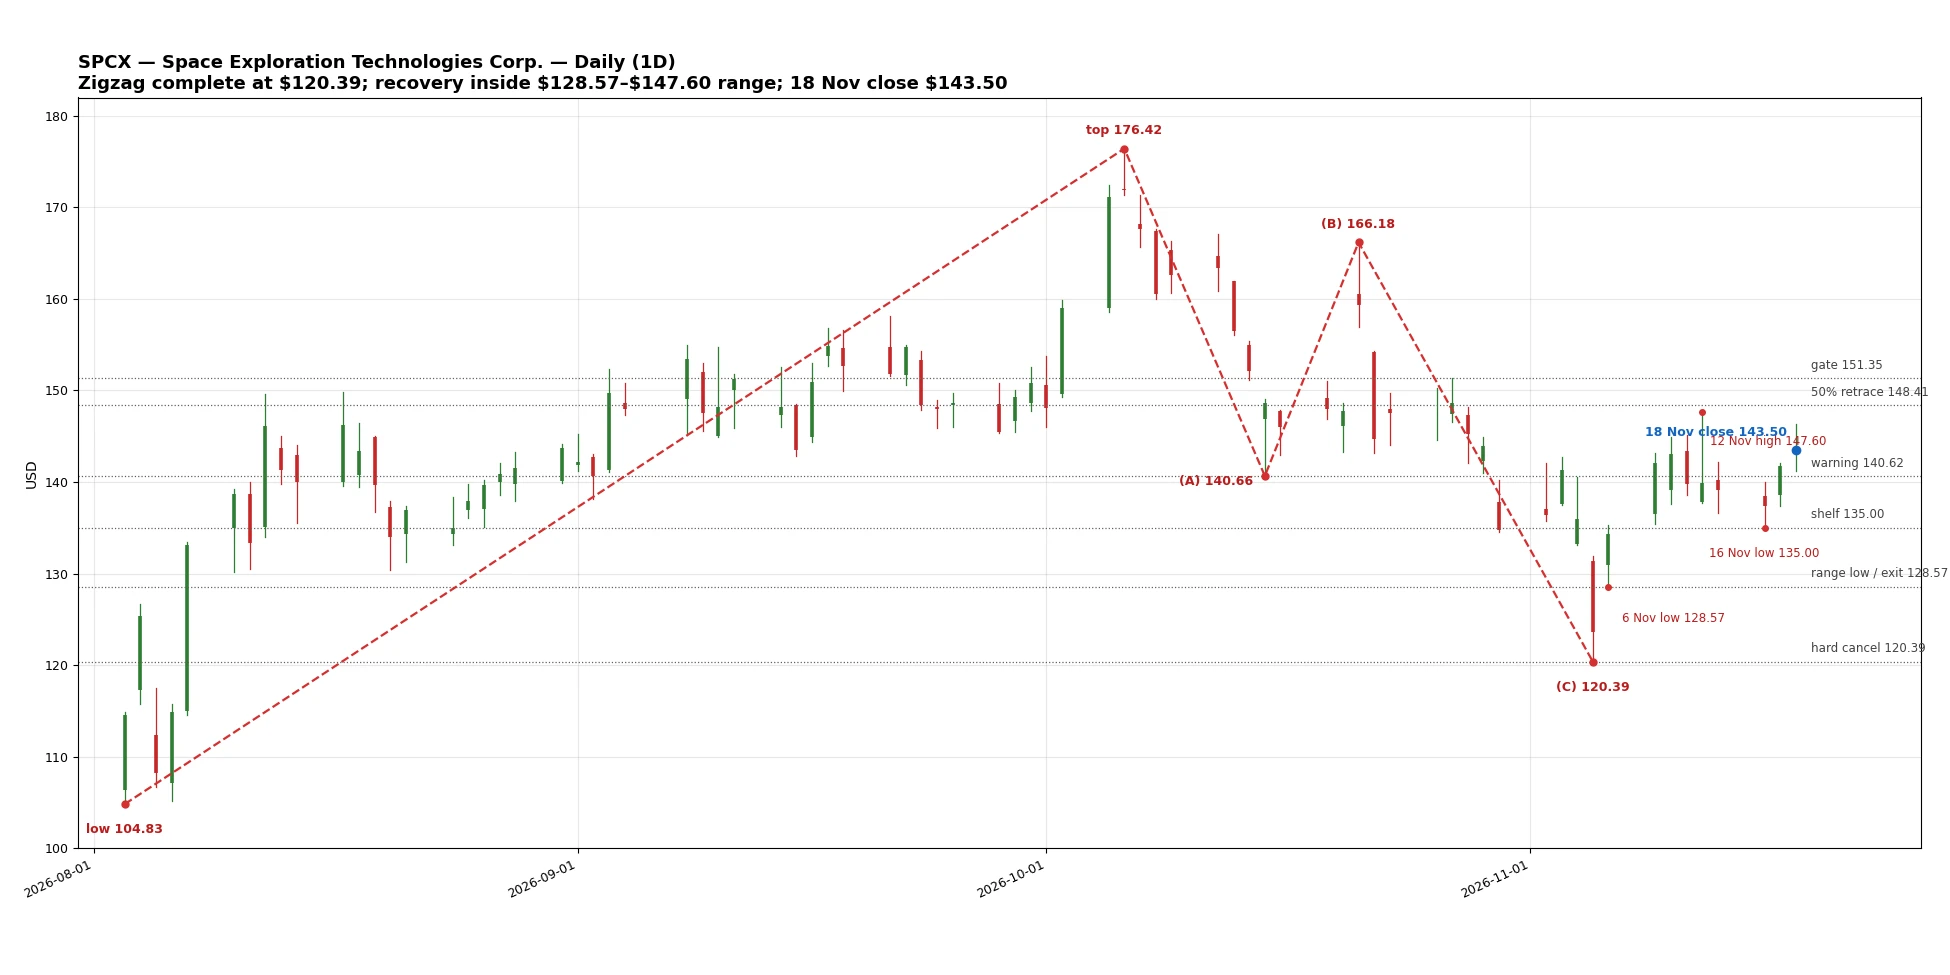
This is a daily-only reading, not the hourly timeframe. The 4 November count — down wave 3 toward $130.42, then $108.32 — is cancelled: the Elliott validation engine rejects it, because wave 4 at $147.60 (12 November) entered wave 1 territory at $140.66 — an overlap that invalidates the impulse on a hard rule. What stands in its place is a completed corrective zigzag (A-B-C): A from $176.42 to $140.66 ($35.76), B a rebound to $166.18 (71.4% of A), and C a fall to $120.39 ($45.79 = 1.28×A) — with the low sitting just $0.24 above the 78.6% retracement of the full 104.83–176.42 advance ($120.15). The low is credible but unconfirmed: there is no five-wave impulse up from it yet, and the recovery from it has an overlapping shape so far.
The 18 November close at $143.50 (+1.27%) is the highest since 30 October, the second straight close above the $140.62 warning level (after $141.70 on 17 November), just above the 50% retracement of the C leg at $143.28, and sits in the upper quarter of the post-washout range $128.57–$147.60 (78.5% up the range). The 18 November close above $142.11 also confirmed the 16–17 November Bullish Kicker — a first repair signal only (a candlestick observation), not a bottom confirmation. Price is still below the 50-day average (~$148.38).
The key question: does the recovery break the range top at $147.60–$148.41, or is it rejected there and sent back to test the $135.00–$136.10 shelf?
Current state in this analysis: No confirmed bottom and no confirmed trend; a completed corrective zigzag at a credible but unconfirmed low, with price in the upper part of the range — wait, with low-to-medium confidence because the low is not yet confirmed by a break of the range top or an upward impulse.
Where Are We in the Market Structure?
The wave count in detail
- The old advance (complete): from the $104.83 low (3 August) to the $176.42 top (6 October). The pullback from it is a correction so far, not a confirmed trend reversal.
- The down zigzag (A-B-C) — complete:
- A: from $176.42 to $140.66 (15 October), a length of $35.76.
- B: a rebound to $166.18 (21 October), a 71.4% retracement of A — deep, but it did not break the start of A at $176.42.
- C: from $166.18 to $120.39 (5 November), a length of $45.79, i.e. 1.28×A — a normal extension for a C leg.
- The washout (5 November): a violent washout candle — low $120.39, close $123.62 (-9.05%) on 171.4 million shares — then a sharp reversal: +8.62% on 6 November (close $134.27) and +5.81% on 9 November (close $142.07).
- The recovery from the low (in progress): from $120.39 to a high of $147.60 (12 November), i.e. $27.21, or 59.4% of the C leg; then a pullback to $135.00 (16 November) — the shelf — then a rise to the 18 November close of $143.50. The pullback from the recovery high so far is only 15.1% of the recovery.
- The post-washout range: low $128.57 (6 November) to high $147.60 (12 November).
Elliott rules check
- The 4 November down-impulse count is cancelled: wave 4 at $147.60 entered wave 1 territory ($140.66) — an overlap that invalidates the impulse on a hard rule (validation engine: FAIL). The 176.42–120.39 fall is not a valid five-wave impulse, even though its old target $130.42 was broken on the 5 November close ($123.62) and then reclaimed the next session — so the break did not hold.
- The A-B-C zigzag is valid in shape: B did not break the start of A ($176.42), C = 1.28×A, and the low sits on the 78.6% Fibonacci retracement of the full advance ($120.15).
- Main weakness: the $120.39 low is unconfirmed — there is no five-wave impulse up from it, and the recovery from it is overlapping (high $147.60, then a pullback to $135.00, then a rise) — so the recovery itself looks corrective so far, not a confirmed reversal.
- The 18 November close above $142.11 confirmed the 16–17 November Bullish Kicker — a first repair signal only (a Japanese candlestick observation), not a bottom confirmation.
What is not confirmed yet
Is $120.39 the final low of the correction, or just a stop on the way to a new down leg? The dividing line: a daily close above $148.41 (the 50% retracement of the full decline, with the 50-day average at ~$148.38 beside it) confirms a deeper recovery; a close below $135.00 retests $128.57, then $120.39.
The Levels That Matter
| Level or zone in USD | Its role in the analysis | What are we watching? |
|---|---|---|
| $176.42 | 6 October top and zigzag start | Bearish structure reference |
| $166.18 | B top of the zigzag | Distant resistance |
| $155.02 | 61.8% retracement of the full decline 176.42–120.39 | Deeper recovery target |
| $151.35 | The gate (27 October high $151.36) | A close above it opens $155.02 |
| $148.41 | 50% retracement of the full decline | A close above it confirms a deeper recovery |
| ~$148.38 | 50-day average | Trend resistance; price is below it |
| $147.60 | 12 November high / range top | A close above it opens $148.41 |
| $146.31 | 18 November high | Near session resistance |
| $143.50 | 18 November close | Current price |
| $143.28 | 50% retracement of the C leg (166.18–120.39) | Close just above it (+$0.22) |
| $142.11 | 17 November high / Kicker confirmation | Closed above it on 18 November |
| $141.79 | 38.2% retracement of the full decline | Near support — close above it |
| $140.62–$140.66 | 50% retracement of the full advance / A low — warning level | Two closes above it (17 and 18 November) |
| $135.00 | 16 November low / the shelf | A close below it weakens the recovery |
| $132.18 | 61.8% retracement of the full advance | Support |
| $128.57 | 6 November low / range low | A close below it = exit from the recovery read |
| $120.39 | 5 November low / end of C | A close below it = hard cancel |
| $120.15 | 78.6% retracement of the full advance | The low sits $0.24 above it |
| $108.32 | 1.618 extension of the cancelled impulse count | Opens only below $120.39 |
| $104.83 | 3 August low | Low of the old advance |
| None | 200-day average | The stock listed in June 2026, and there are not 200 daily candles yet — no figure is invented here |
Confirmation standard used here: a daily close, not an intraday touch. A "strong break" means a clear daily close beyond the level, with follow-through in the next session.
Base Scenario — Recovery inside the range toward $147.60–$148.41, with no confirmed bottom
The idea: The zigzag is complete at $120.39 (a credible but unconfirmed low), and price is recovering inside the $128.57–$147.60 range: the 18 November close of $143.50 is the highest since 30 October, above $140.62 for two sessions, above the 50% retracement of the C leg ($143.28), with the Kicker confirmed above $142.11. But price is still below the 50-day average (~$148.38) and below the range top — so the recovery is not yet confirmed.
It strengthens if: Price closes above $147.60, then above $148.41.
Potential zones, in order:
- $147.60: the range top (12 November high).
- $148.41: the 50% retracement of the full decline (with the 50-day average at ~$148.38 beside it).
- $151.35–$155.02: the gate, then the 61.8% retracement of the full decline.
Scenario invalidation: A daily close below $135.00 weakens the recovery; a close below $128.57 cancels it; a close below $120.39 cancels the low read entirely.
Alternative Scenario — Rejection from the range top, back toward the shelf and the low
It becomes more likely if: Price is rejected at $147.60–$148.41 and closes below $140.62.
The likely path: A pullback toward the $135.00–$136.10 shelf first, then toward $128.57 if the shelf breaks on a close, then a test of $120.39.
What weakens this path: A daily close above $148.41, then above $151.35.
Scenario invalidation: A daily close above $151.35 makes the "rejection from the top" scenario unlikely in the near term; a close above $148.41 weakens it first.
What Confirms a Trend Change on the Daily Timeframe?
- Available so far: A completed zigzag at $120.39 on the 78.6% retracement, a 59.4% recovery of the C leg, two closes above $140.62, and the Kicker confirmed above $142.11 — but with no upward impulse and no break of the range top.
- Still missing for confirmation: A daily close above $148.41 to confirm a deeper recovery toward $151.35–$155.02, or a close below $135.00 to confirm the recovery is weakening.
Upcoming Events and Risks
- Standing note on the SPCX results date (decided by Bassem on 2026-11-02, applying to every run until changed): there are no SPCX results on Tuesday 3 November 2026. The Q3 report was already published on Tuesday 20 October 2026 after close, and the 3 November dates shown by some aggregators are old estimates for that same quarter. The next results are Q4, due in February 2027, and the exact day is not confirmed yet (TipRanks and TradingView mention 25 February, and other estimators differ) — and no single exact SPCX results day is printed until the company itself confirms it.
- Volatility: a recently listed stock with huge trading volume (171.4 million shares on the 5 November washout candle); 6–9% moves in one day are not unusual for it, and gaps can overshoot the stated levels.
Conclusion
Under this count, the SPCX down zigzag is complete at $120.39 — a credible but unconfirmed low — and price is recovering inside the $128.57–$147.60 range, closing 18 November at $143.50.
Above $147.60 on a daily close: it tests $148.41 (the 50% retracement + the 50-day average).
Above $148.41 on a daily close: a deeper recovery toward $151.35, then $155.02, is confirmed.
Below $140.62 on a daily close: warning — the recovery weakens and the $135.00 shelf comes back into focus.
Below $135.00 on a daily close: confirmed weakness toward $128.57.
Below $128.57 on a daily close: exit from the recovery read, toward $120.39.
Below $120.39 on a daily close: hard cancel — opens $108.32, then $104.83.
*This analysis is based on daily data through the 18 November 2026 close, and needs reassessment after every daily close, when a stated level breaks, and before and after earnings. The zones mentioned are conditional possibilities, not guaranteed prices.*